The Explorer GroupThe Explorer GroupThe Explorer GroupThe Explorer Group
  • HOME
  • ABOUT
  • TEAM
  • PORTFOLIO
  • BLOG
  • CONTACT US
  • LOGIN

What the current US venture industry looks like in 24 charts

    Home Deals What the current US venture industry looks like in 24 charts
    NextPrevious

    What the current US venture industry looks like in 24 charts

    By Daniel Laury | Deals, Venture Capital | Comments are Closed | 26 April, 2017 | 1

    Original Source: http://bit.ly/2oJxHq8

    April 25, 2017

    The US venture market was a bit unsettled heading into 2017. Dealmaking last year was a bit frosty compared to 2014 and 2015, when capital seemed easy to come by. To be fair, there were many unknowns: Would the new president’s policies have a major impact on investment? How would the public markets embrace unicorns and other highly valued startups? What would fundraising look like following two record years?

    The early indication is that 2017 will be a healthy year for VC, and the recently published 1Q 2017 PitchBook-NVCA Venture Monitor report lays out all the current trends in the US venture market to help explain how the industry is moving. Here’s a recap of the top 24 charts from the report:

    DEALS

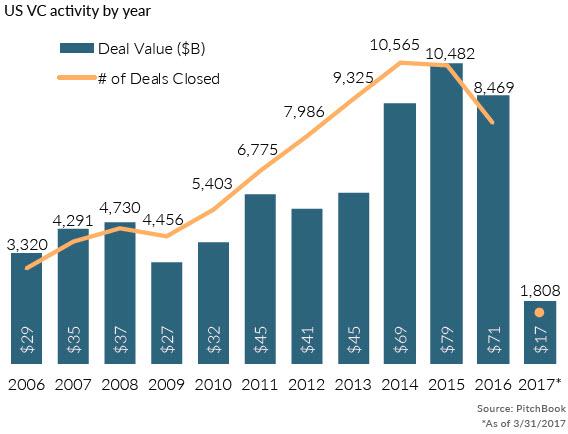
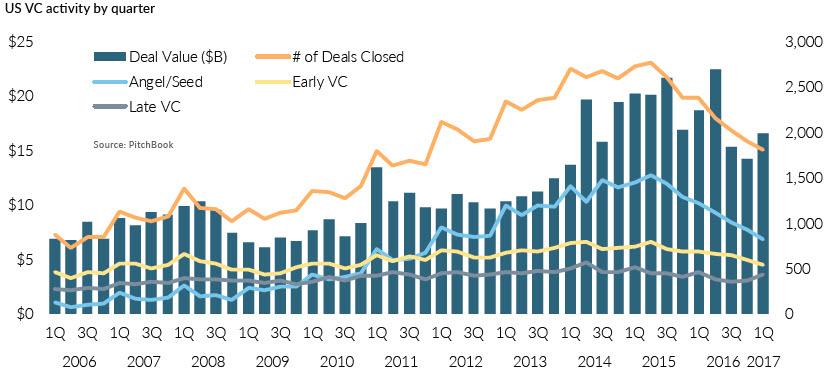
    Activity and deal value have started the year off slow

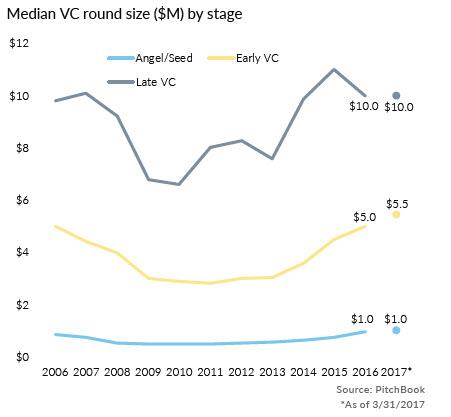
    Median deal size has stayed at heightened levels at every stage

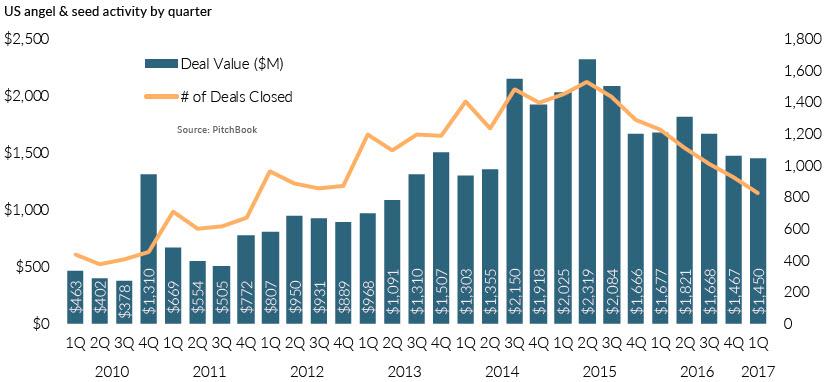
    Angel & seed deals have seen the deepest drop

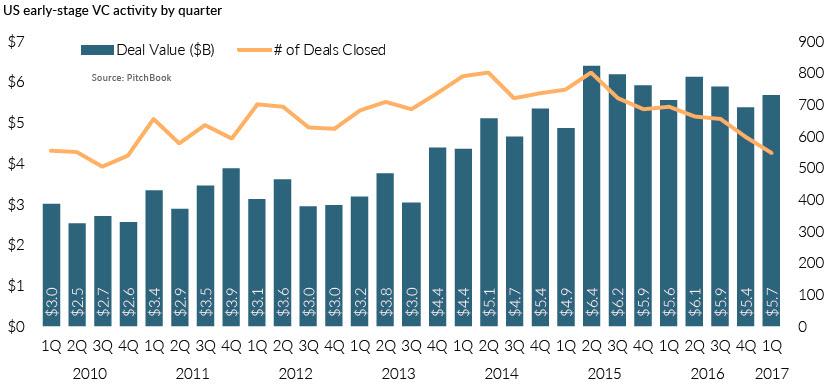
    Early-stage deal value has come to somewhat of a plateau

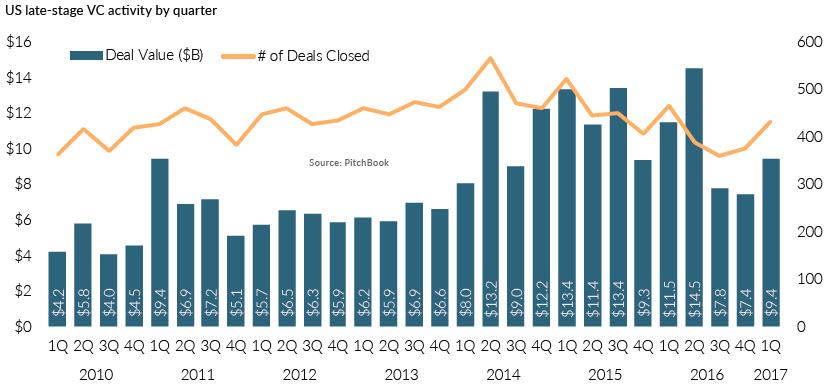
    The late stage has seen an increase in deals the past two quarters

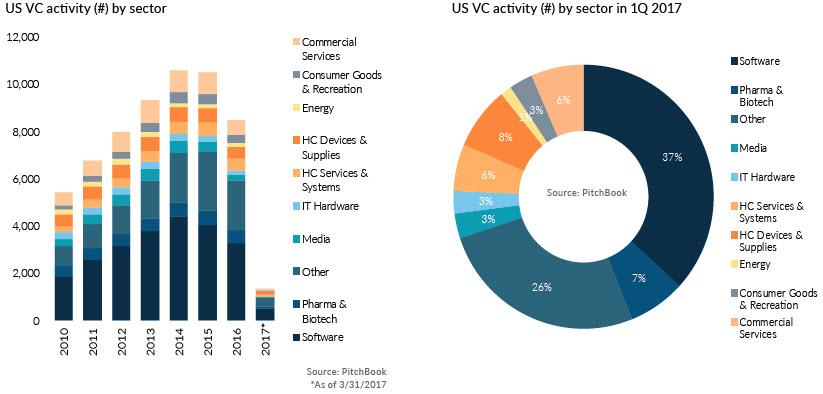
    Software received 37% of the deal flow in 1Q

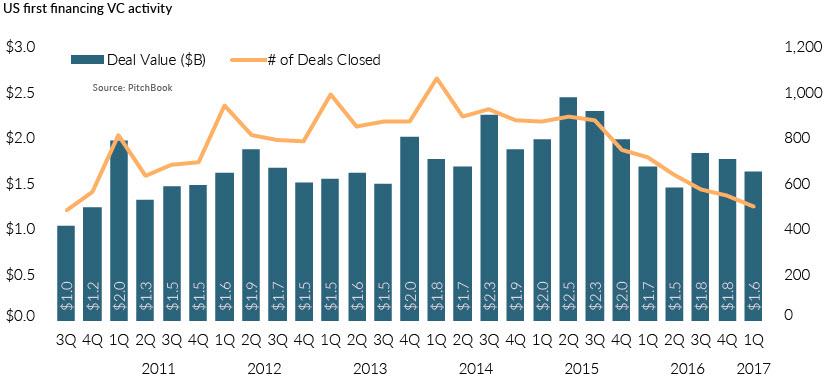
    First financing activity has fallen for seventh consecutive quarters

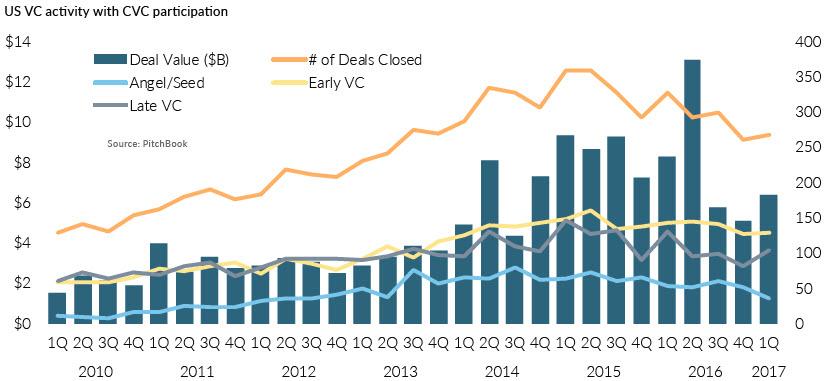
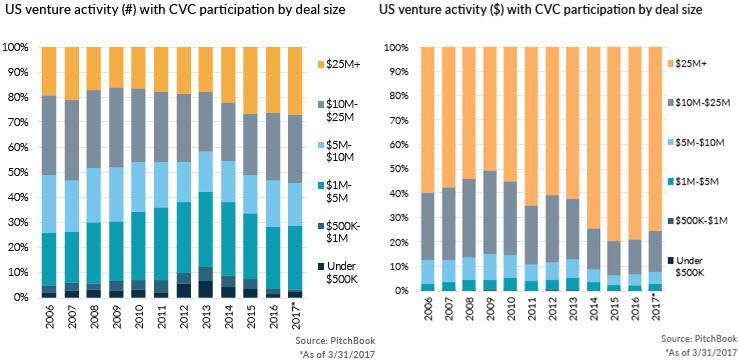
    Corporate VC participation has stayed relatively strong

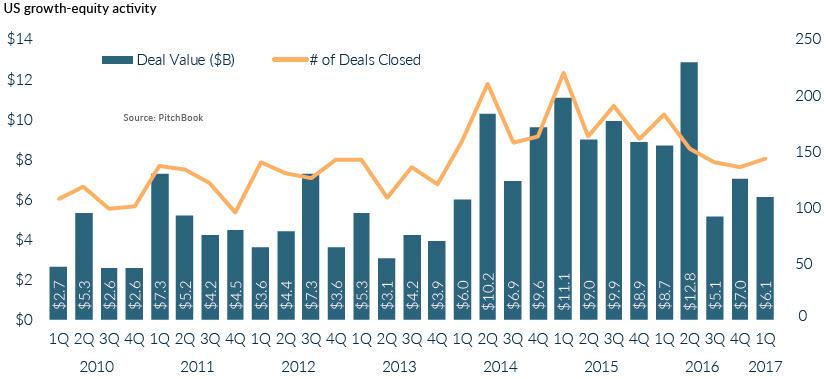
    Growth equity deals have declined in count and value during recent quarters

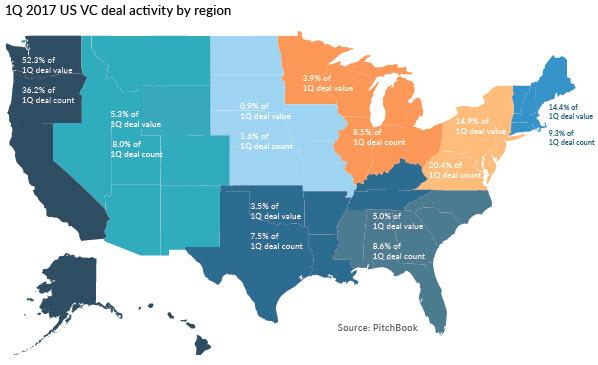
    More than 50% of 1Q deal value was in West Coast-headquartered companies

    EXITS

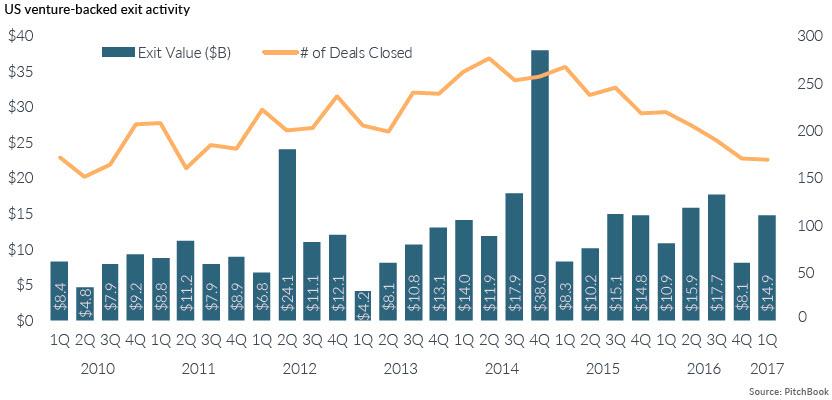
    Large exits by Snap ($3.4B) and AppDynamics ($3.7B) account for much of 1Q value
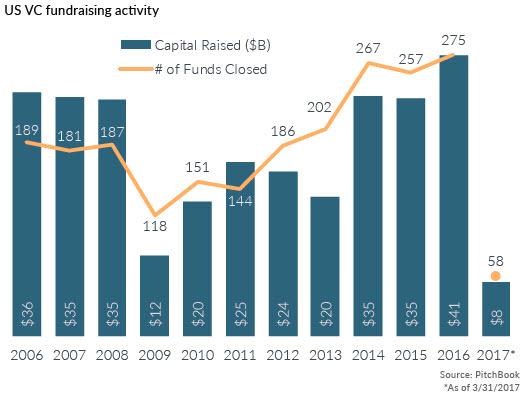
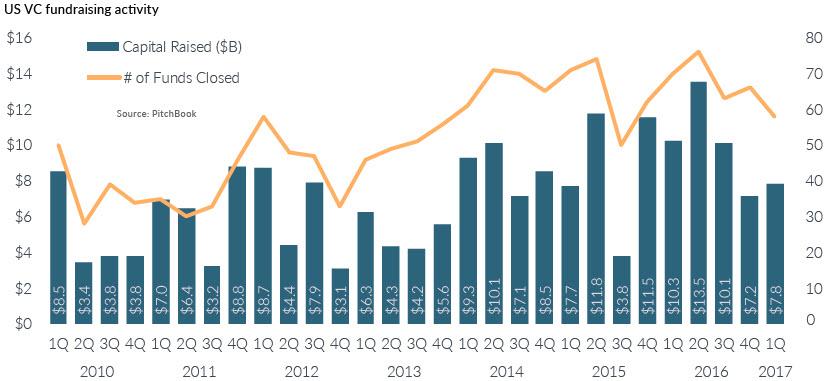
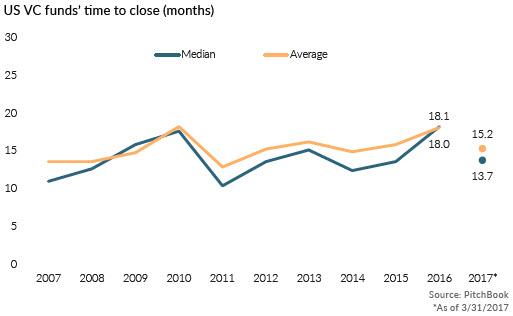
    FUNDRAISING

    Fundraising on pace to surpass $30 billion for the fourth straight year

    For a full breakdown of the US venture industry, download your free copy of the 1Q 2017 PitchBook-NVCA Venture Monitor.

    VC deals, vc exits, VC fundraising, Venture capital

    Daniel Laury

    More posts by Daniel Laury

    Related Post

    • The current state of venture capital in 18 charts

      By Daniel Laury | Comments are Closed

      Original Source: http://bit.ly/2dqUC3A Joshua Mayers October 18, 2016 We recently released our inaugural PitchBook-NVCA Venture Monitor as a comprehensive resource on all matters venture capital. You can download the full 20-page report for free, but ifRead more

    • Venture Capitalists Hunt for the Next Big Thing

      By Daniel Laury | Comments are Closed

      Original Source: http://on.wsj.com/2ey5RMn As they struggle to predict what tech might spark a new boom, investors spread their bets Virtual reality is one of the technologies attracting venture-capital investment. Above, Google’s virtual reality headsets. PHOTO: RICHARDRead more

    • Andreessen Horowitz’s Returns Trail Venture-Capital Elite

      By Daniel Laury | Comments are Closed

      Original Source: http://on.wsj.com/2bTZ2jt Rare look at startup investors’ performance shows Andreessen Horowitz lags behind Sequoia, Benchmark, Founders Fund Andreessen Horowitz, co-founded by web pioneer Marc Andreessen in 2009, is routinely mentioned among the pantheon of greatRead more

    • CrunchBase sees some slowing for early-stage venture in the second quarter

      By Daniel Laury | Comments are Closed

      Original Source: http://tcrn.ch/2aeVGf6 Posted yesterday by Gené Teare, Joanna Glasner Gené Teare CRUNCH NETWORK CONTRIBUTOR  Gené Teare is the Head of Content atCrunchBase. Joanna Glasner CRUNCH NETWORK CONTRIBUTOR  Joanna Glasner is a reporter for CrunchBase.   U.S. ventureRead more

    • Fundraising is a numbers game

      By Daniel Laury | Comments are Closed

      Original Source: http://bit.ly/1TjYsdd By Nic Brisbourne – May 4, 2016 These are Forward Partners dealflow stats for the first four months of 2016 832 leads 47 first meetings (6% of leads) 8 second meetings (17% of first meetings) 2 dealsRead more

    NextPrevious

    Categories

    • Artificial Intelligence
    • Autonomous Driving
    • Big Data
    • Deals
    • Deep Learning
    • Drones
    • Energy
    • Fintech
    • Health Care
    • IoT
    • Portfolio Companies
    • portfolio company news
    • Robotics
    • Space
    • tech news
    • Transportation
    • Uncategorized
    • Venture Capital
    • Virtual Reality
    • Wearable technology
    • HOME
    • ABOUT
    • TEAM
    • PORTFOLIO
    • BLOG
    • CONTACT US
    • LOGIN
    © 2015 The Explorer Group All Rights Reserved |Privacy Policy
    • HOME
    • ABOUT
    • TEAM
    • PORTFOLIO
    • BLOG
    • CONTACT US
    • LOGIN
    The Explorer Group